Learn Correlation Coefficient For JEE Main

The National Testing Agency conducts the first session of the JEE Main exam 2022 in the month of June. It needs hard work and proper planning to crack this exam. Since the number of students appearing for the JEE Main is quite high, the competition level is also high. As far as the JEE Main exam is concerned, statistics is an important topic from which candidates can score full marks easily. Most of the questions can be easily answered using formulas and easy calculations. While learning statistics, students are advised to learn all the important formulas in the topic.
In statistics, we can define covariance as a measure that gives an idea about how two random variables vary together. We use the correlation coefficient (ρ) for measuring how strong a relationship between two variables is. The value of ρ lies between -1 and +1. A similar and identical relation between the two variables is denoted by a positive value of ρ. A negative value of ρ shows the dissimilarity between the two variables. When there is no specific relationship between two variables, it shows zero correlation. When the value of one variable increases linearly with an increase in another variable, then we get a positive correlation. When the value of one variable increases linearly with a decrease in another variable, then we get a negative correlation.
Formula
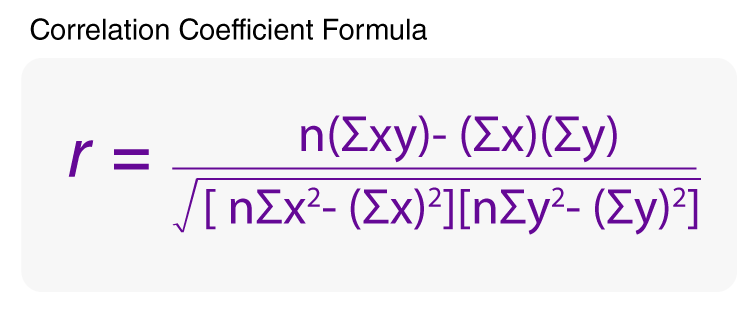
The correlation of two variables, x and y, is given by the following equation:
ρ(x, y) = cov(x, y)/σx σy.
Here, σx denotes the standard deviation of x and σy denotes the standard deviation of y.
ρ(x, y) close to +1 shows an increase in one of the variables associated with an increase in the other variable. ρ(x, y) near -1 shows an increase in one of the variables being associated with a decrease in the other variable.
Assumptions
The assumptions for finding Pearson’s correlation coefficient are as follows. We should approximate the data set, which is to be correlated to the normal distribution. The data points must be paired observations. For every observation of the independent variable, a dependent variable exists. To evaluate ρ(x, y), the data set should contain continuous variables. No outliers should be there in the data. The error term is the same for all the values of the independent variables.
Covariance and correlation
In statistics, a measure that represents the joint variability of two random variables is covariance (cov). Correlation gives the idea of how these variables are related. Students should be aware of the difference between covariance and correlation. Covariance shows the extent of the variable being dependent on each other. A greater value denotes higher dependency.
One can easily crack the JEE Main exam with the right learning resources and the right guidance. Nowadays, a lot of study materials are available on the internet. Students can easily access these resources for free. These resources include online mock tests, important formula pdfs, previous years’ question papers, revision notes, videos of important questions, question paper analysis, ranker’s insights, etc. Visit BYJU’S to learn more about covariance and correlation.